As a medical aesthetic practice, you want your brand to stand out from the competition, but design is a tedious process that can require a lot of software and artistic knowledge.
Unfortunately, not everyone is blessed with these qualities, and for those of us who aren’t graphic designers, it can be a daunting task to create visually appealing content that resonates with our target audience.
But it is important that we create it, because the human brain can remember up to 2,000 images with little learning, and recognize them days later. A hugely beneficial piece of information to know as you try to build relationships with your audience.
Not to mention:
- 90% of information transmitted to the brain is visual
- 65% of people are visual learners
- 40% of people respond better to visual information than plain text
- Humans process visuals 60,000 times faster than plain text
So how do you, a non-designer, create a more visual experience with your content so that patients will remember it, just like I remembered my stories when I was five-and-a-half?
You use design tools for non-designers.
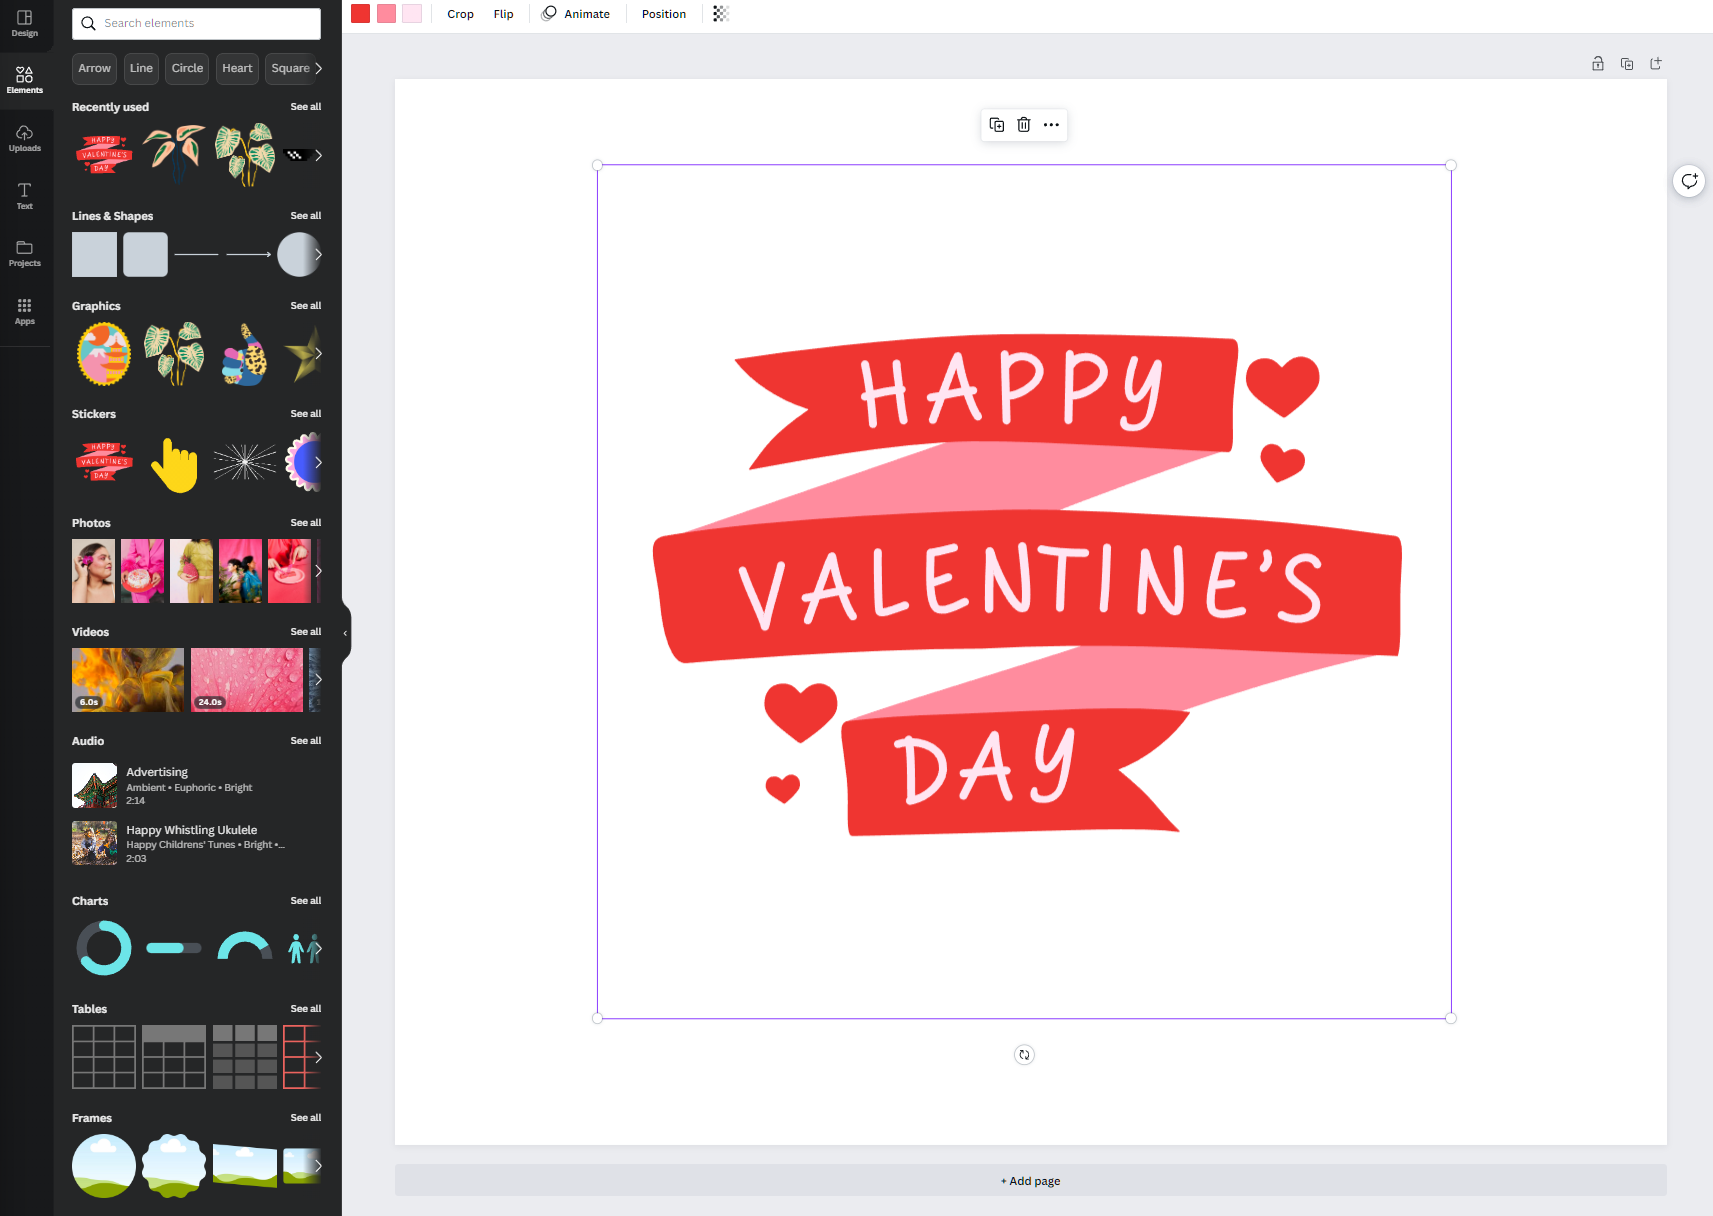
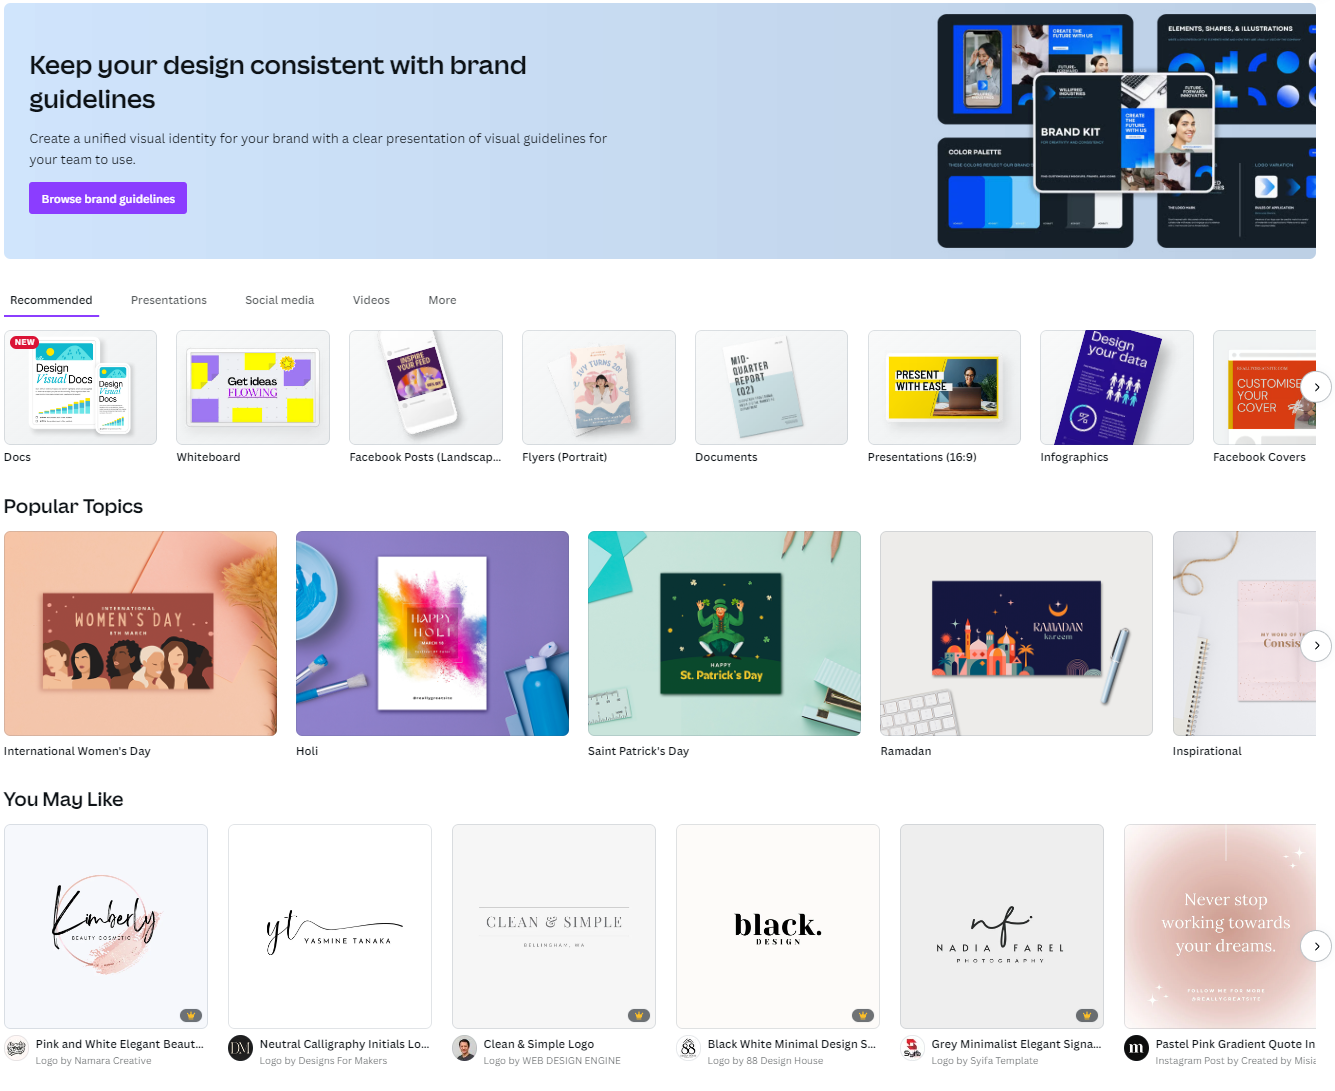
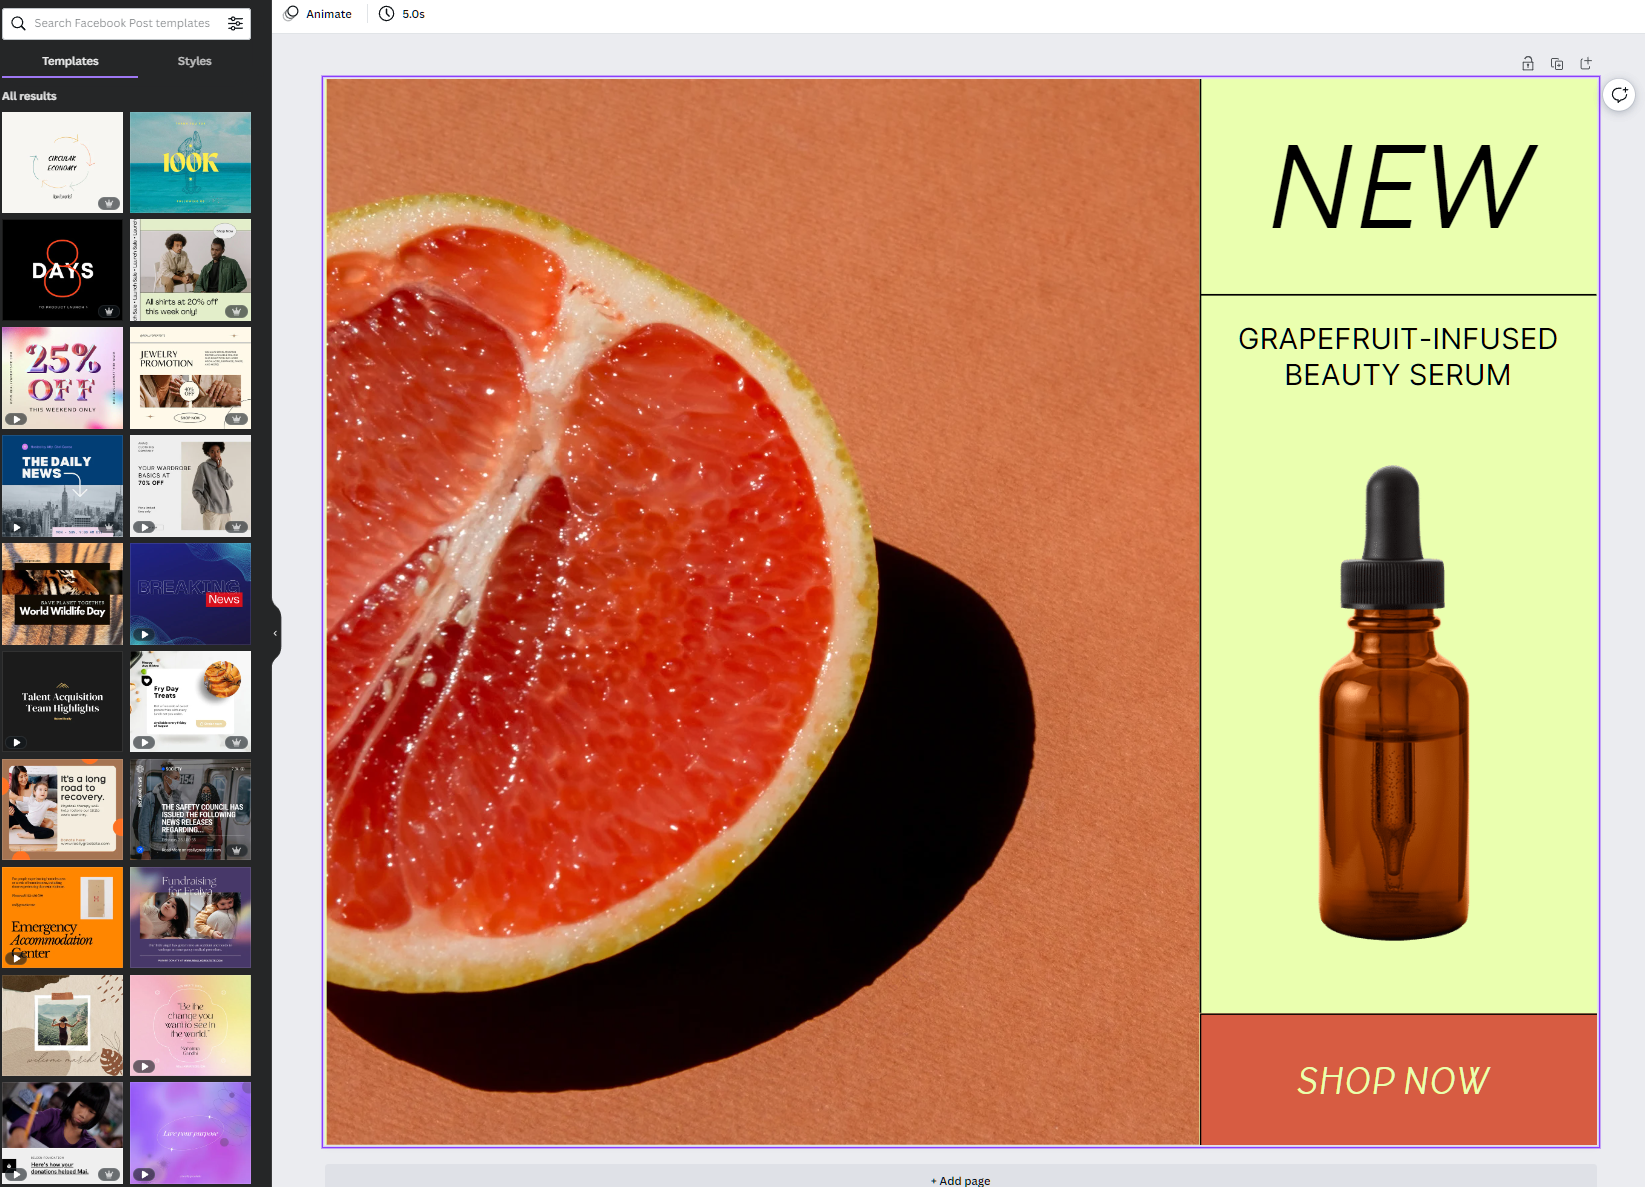
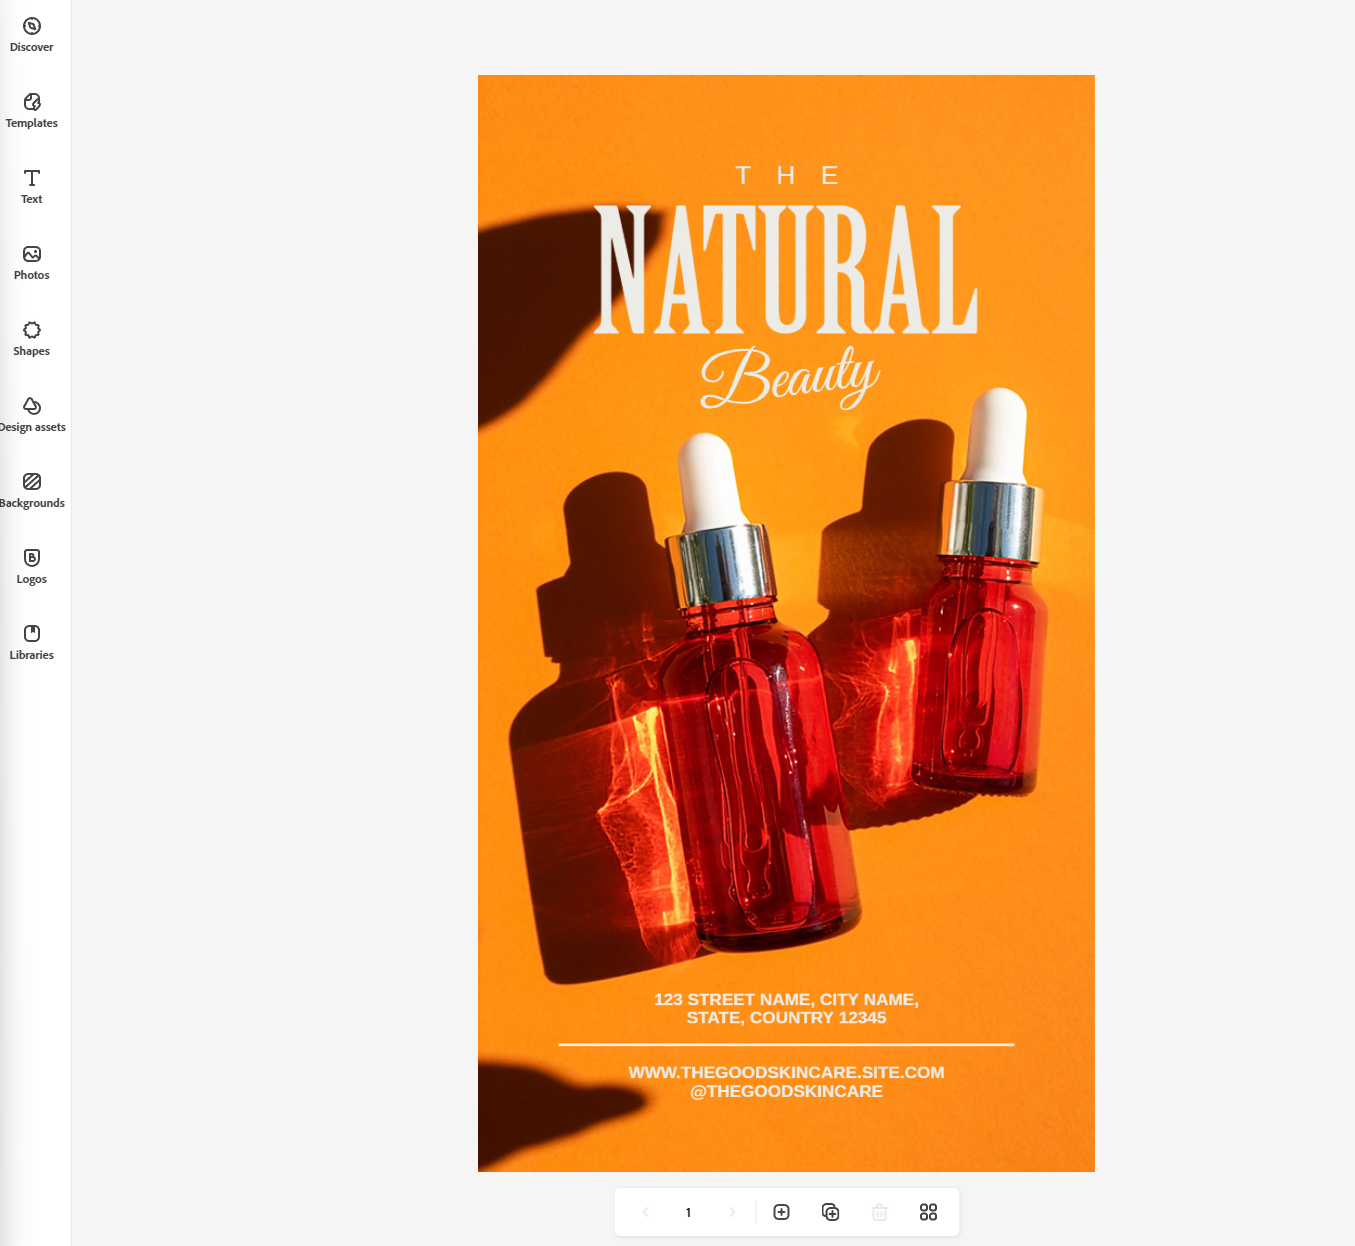
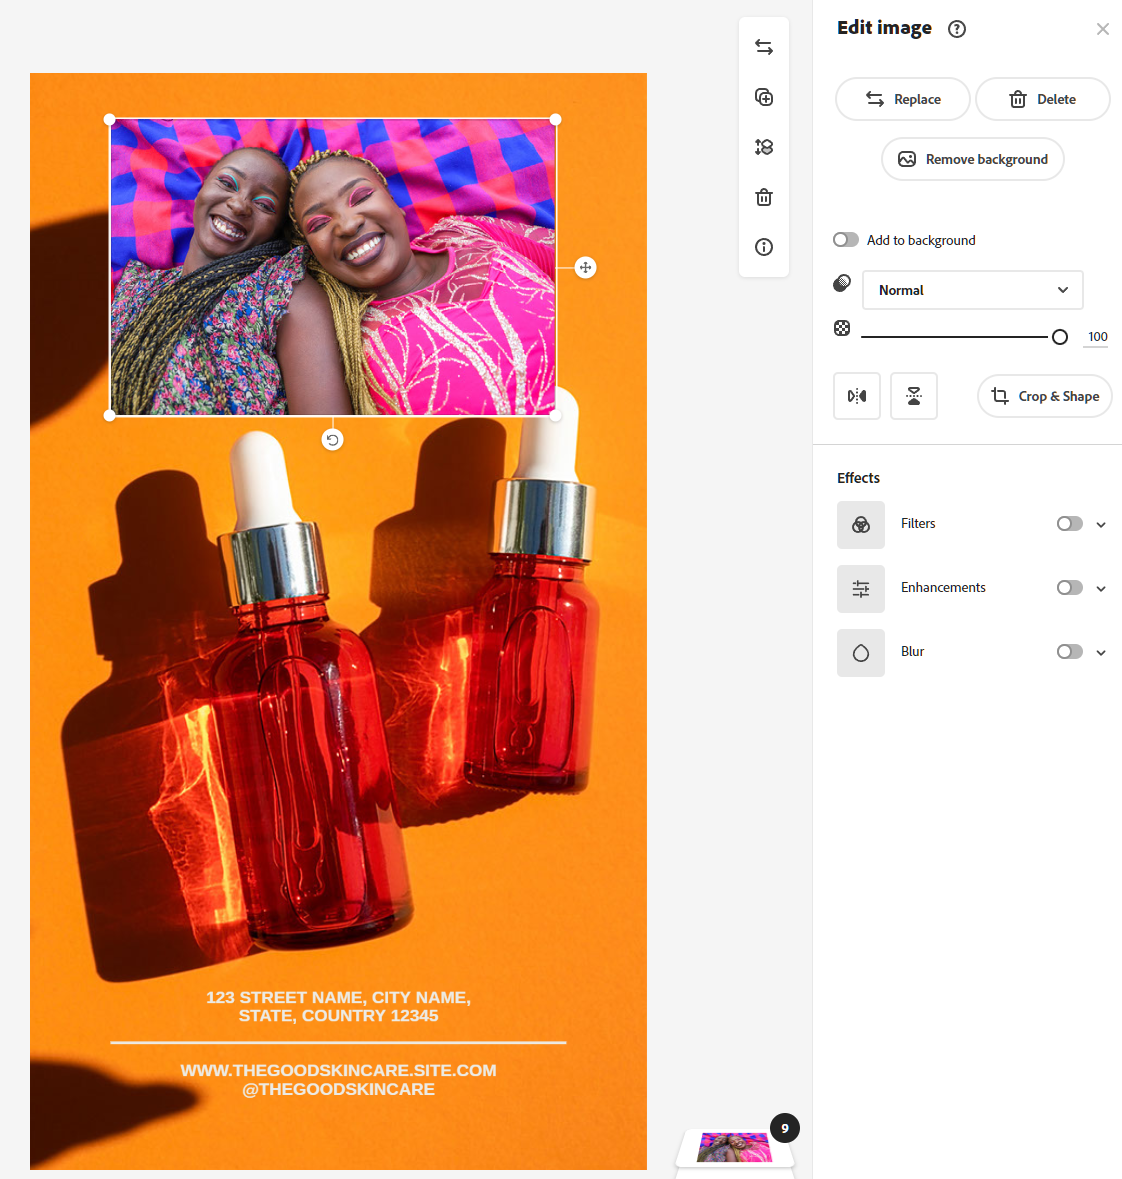
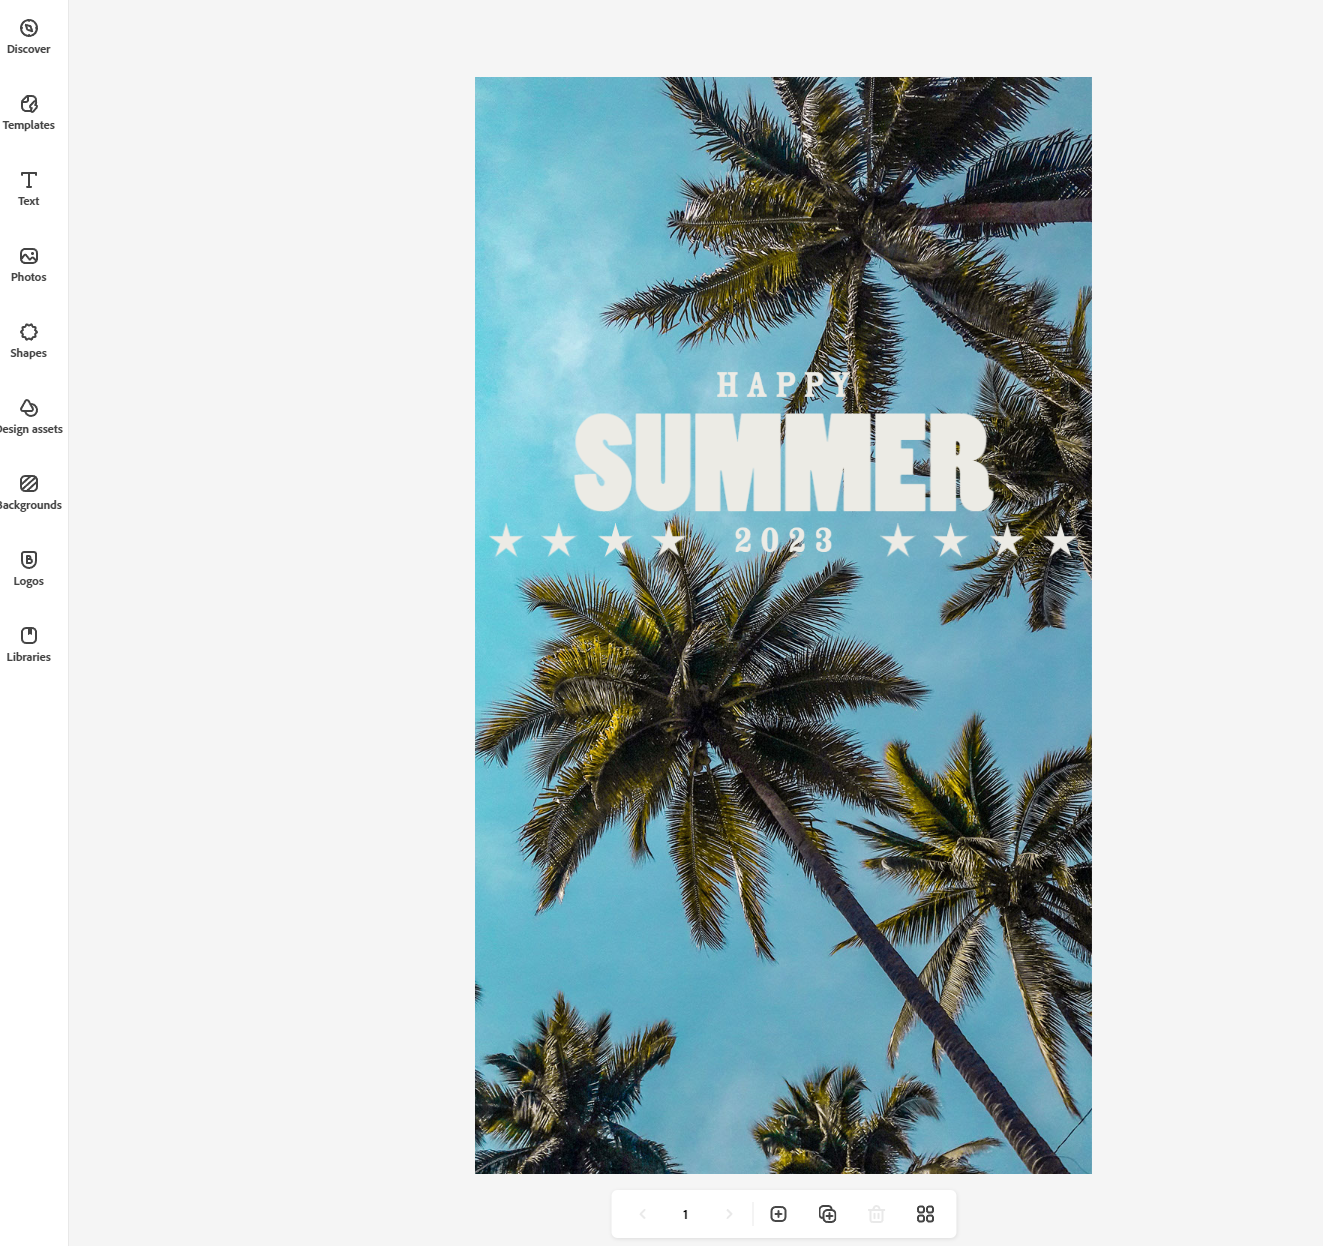
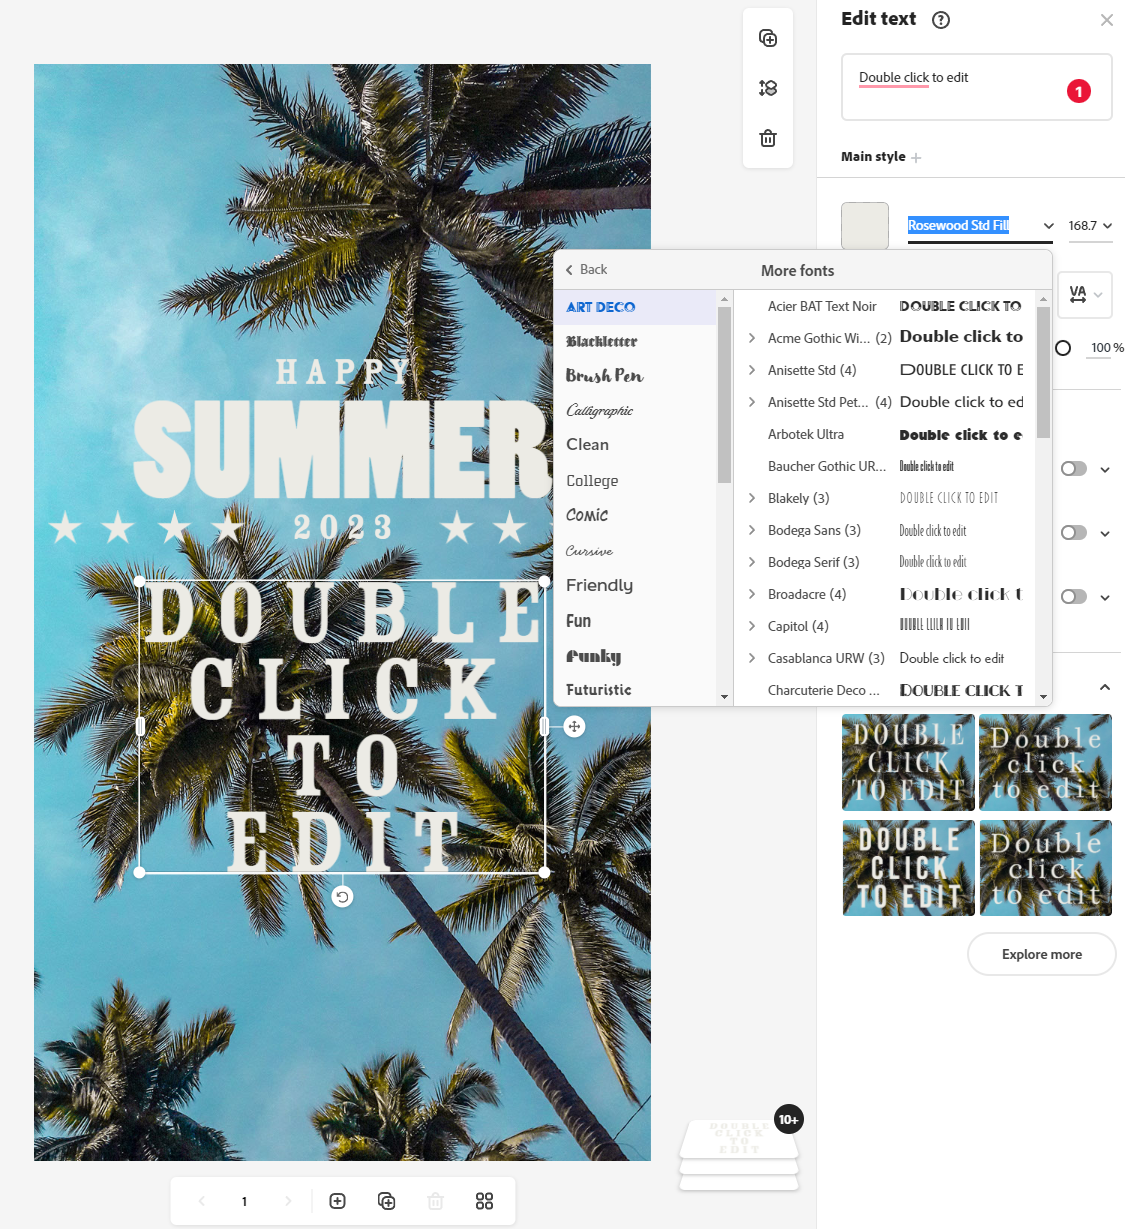
Canva
Canva is a powerhouse for content creators. It is a cloud-based graphic design platform that allows you to create professional-quality designs for social media, presentations, posters, and more.
What’s great about Canva is that it offers a vast library of templates, fonts, graphics, and stock photos that you can use to create custom designs that reflect your brand’s personality.
Some of Canva’s features include:
A drag-and-drop interface that is easy to navigate.
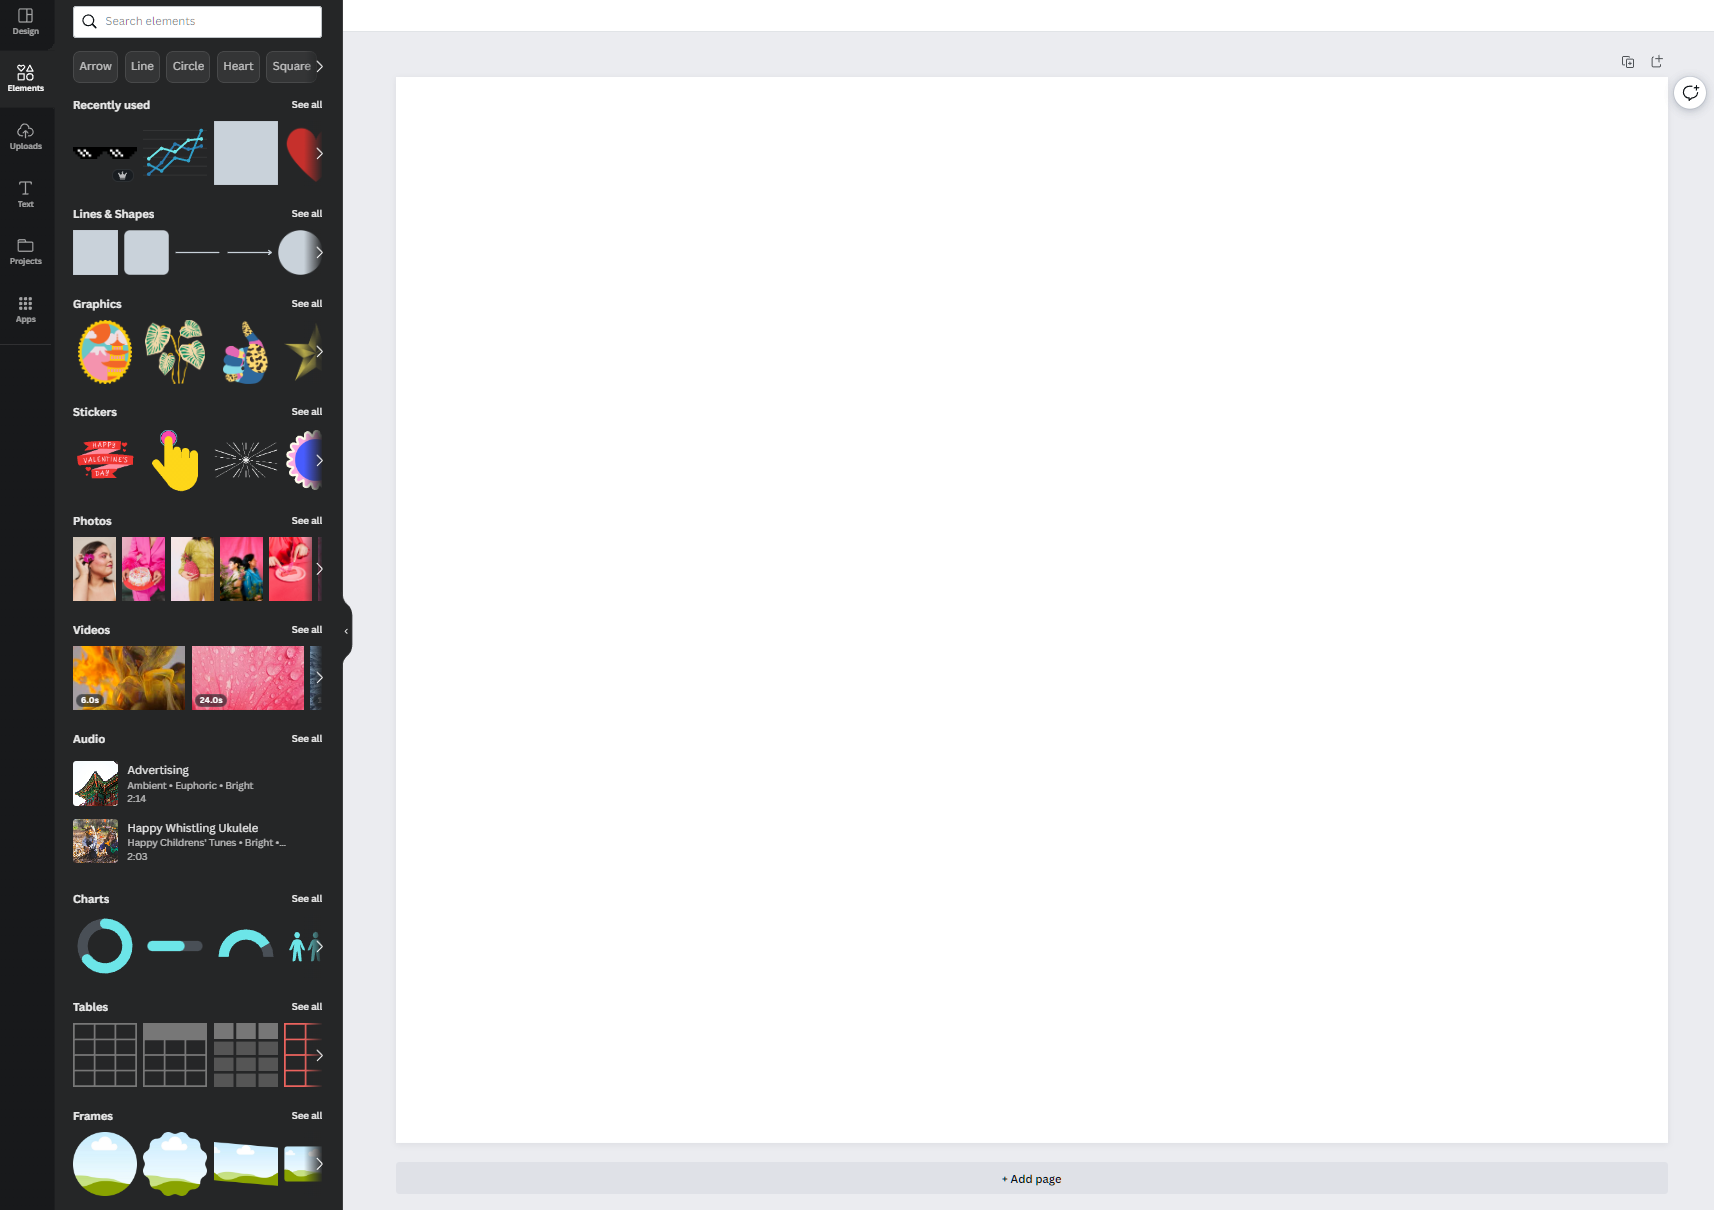
A massive library of stock photos, graphics, and illustrations.
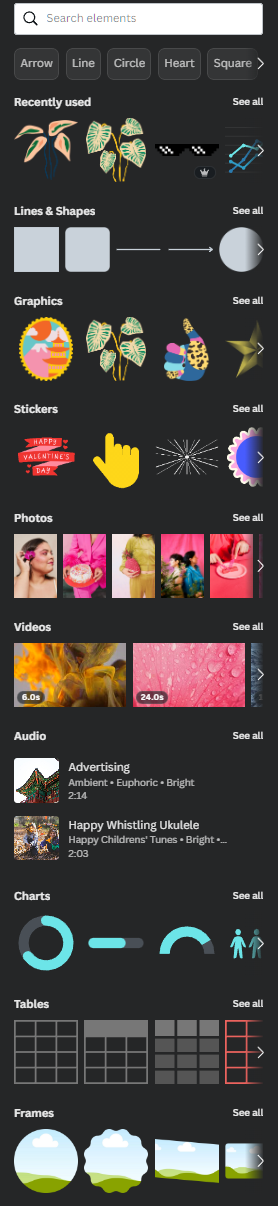
The ability to create custom designs for social media, marketing materials, and presentations.
A range of design templates for everything from Instagram posts to business cards
The ability to collaborate with team members in real-time
If you’re looking for a tool that is easy to use and offers a wide range of design tools without needing to understand complex software, Canva is a very useful and popular option.
Plus, it’s free to use and become acquainted with (premium features are available for a fee), so you can create stunning designs and make sure you like the program without even having to put in a credit card.
Adobe Express
If you are immediately turned off to this option because the name Adobe reminds you of complicated programs like Photoshoop or InDesign, you can relax a bit.
Adobe Express is much closer to Canva than it is Indesign or other design software.
Adobe Express also has a mobile app that allows you to create stunning graphics on the go, using just your phone or tablet.
Some of Adobe Express’s features include:
A simple interface that is easy to use.
A wide range of filters and editing tools for photos.
The ability to add text overlays and custom graphics to your photos.
A library of fonts and design elements to choose from.
The ability to sync your designs across devices using Adobe Creative Cloud.
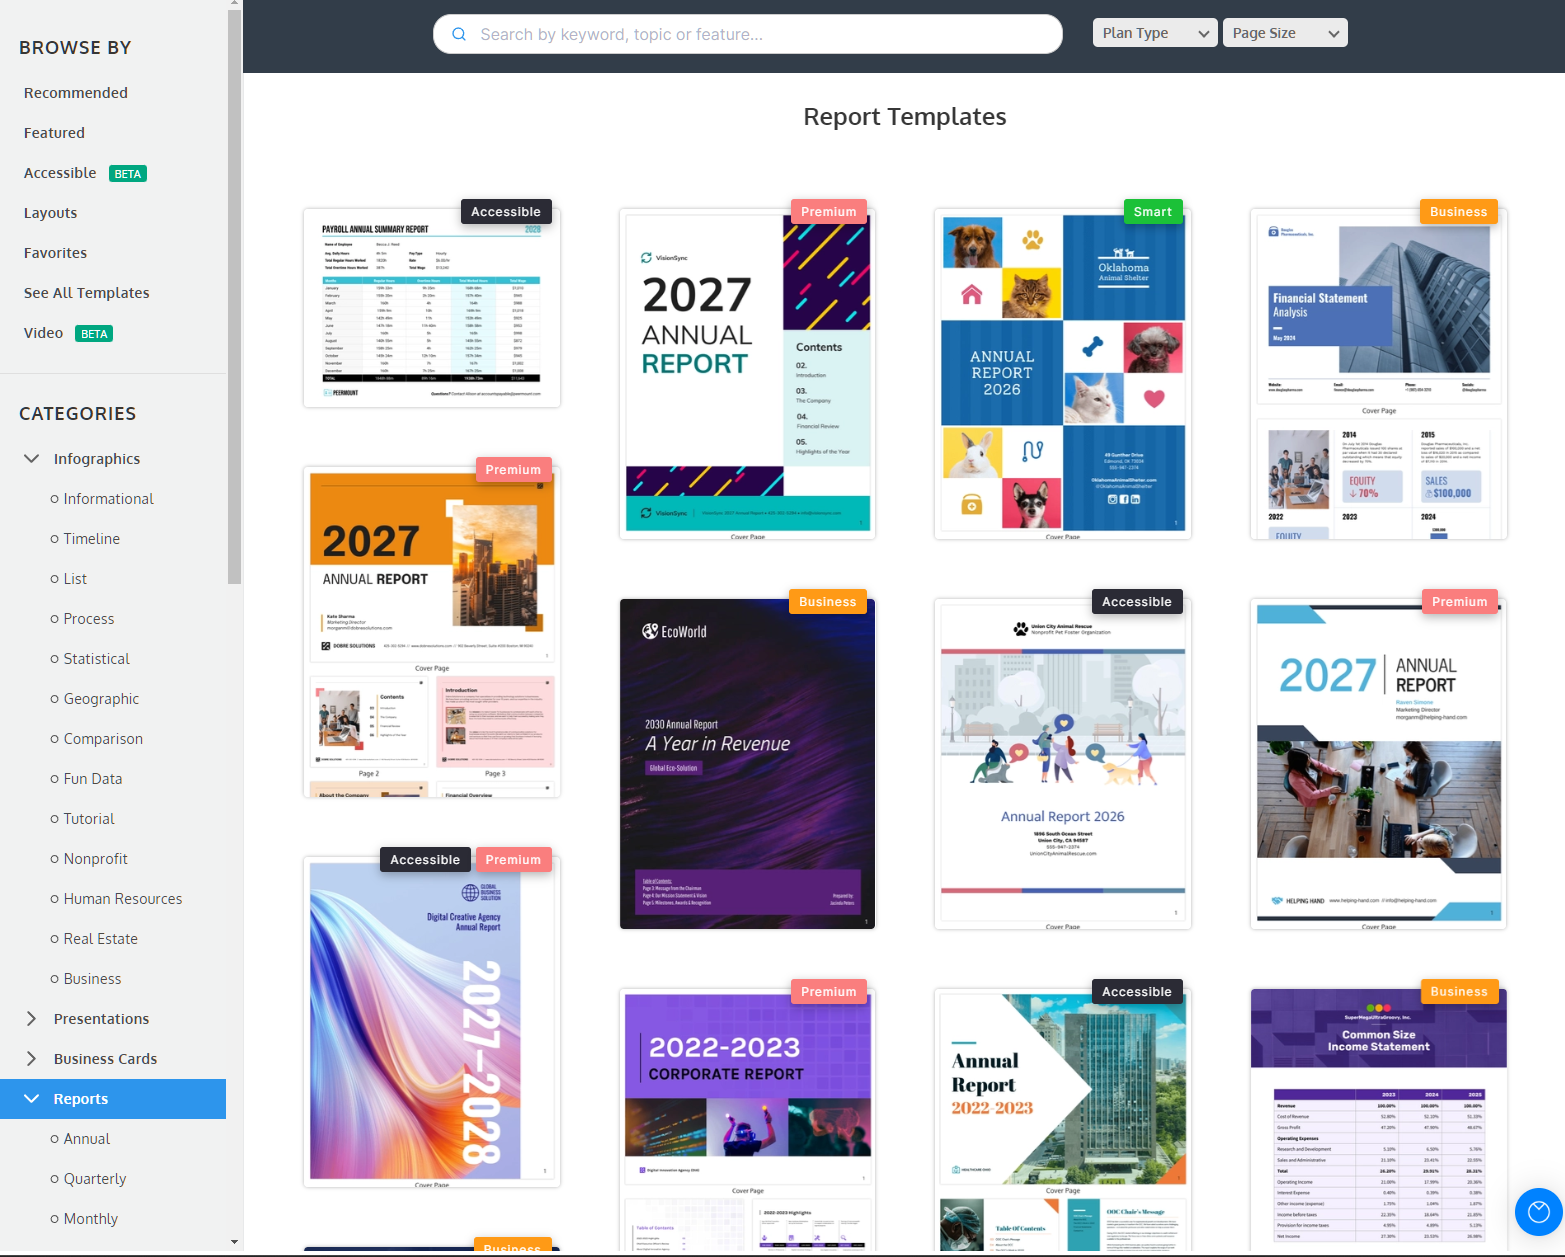
Venngage
If you’re looking to create infographics and data visualizations, Venngage is an insanely powerful tool.
Venngage is another cloud-based design tool that allows you to create stunning infographics, reports, and presentations using a wide range of templates and design elements.
Some of Venngage’s features include:
A range of templates specifically for infographics, reports, and presentations.
A library of charts, icons, and graphics to choose from.
The ability to download your designs as PDFs or PNGs.
Venngage is perfect for non-designers who need to create professional-quality infographics and data visualizations for their medical aesthetic practice.
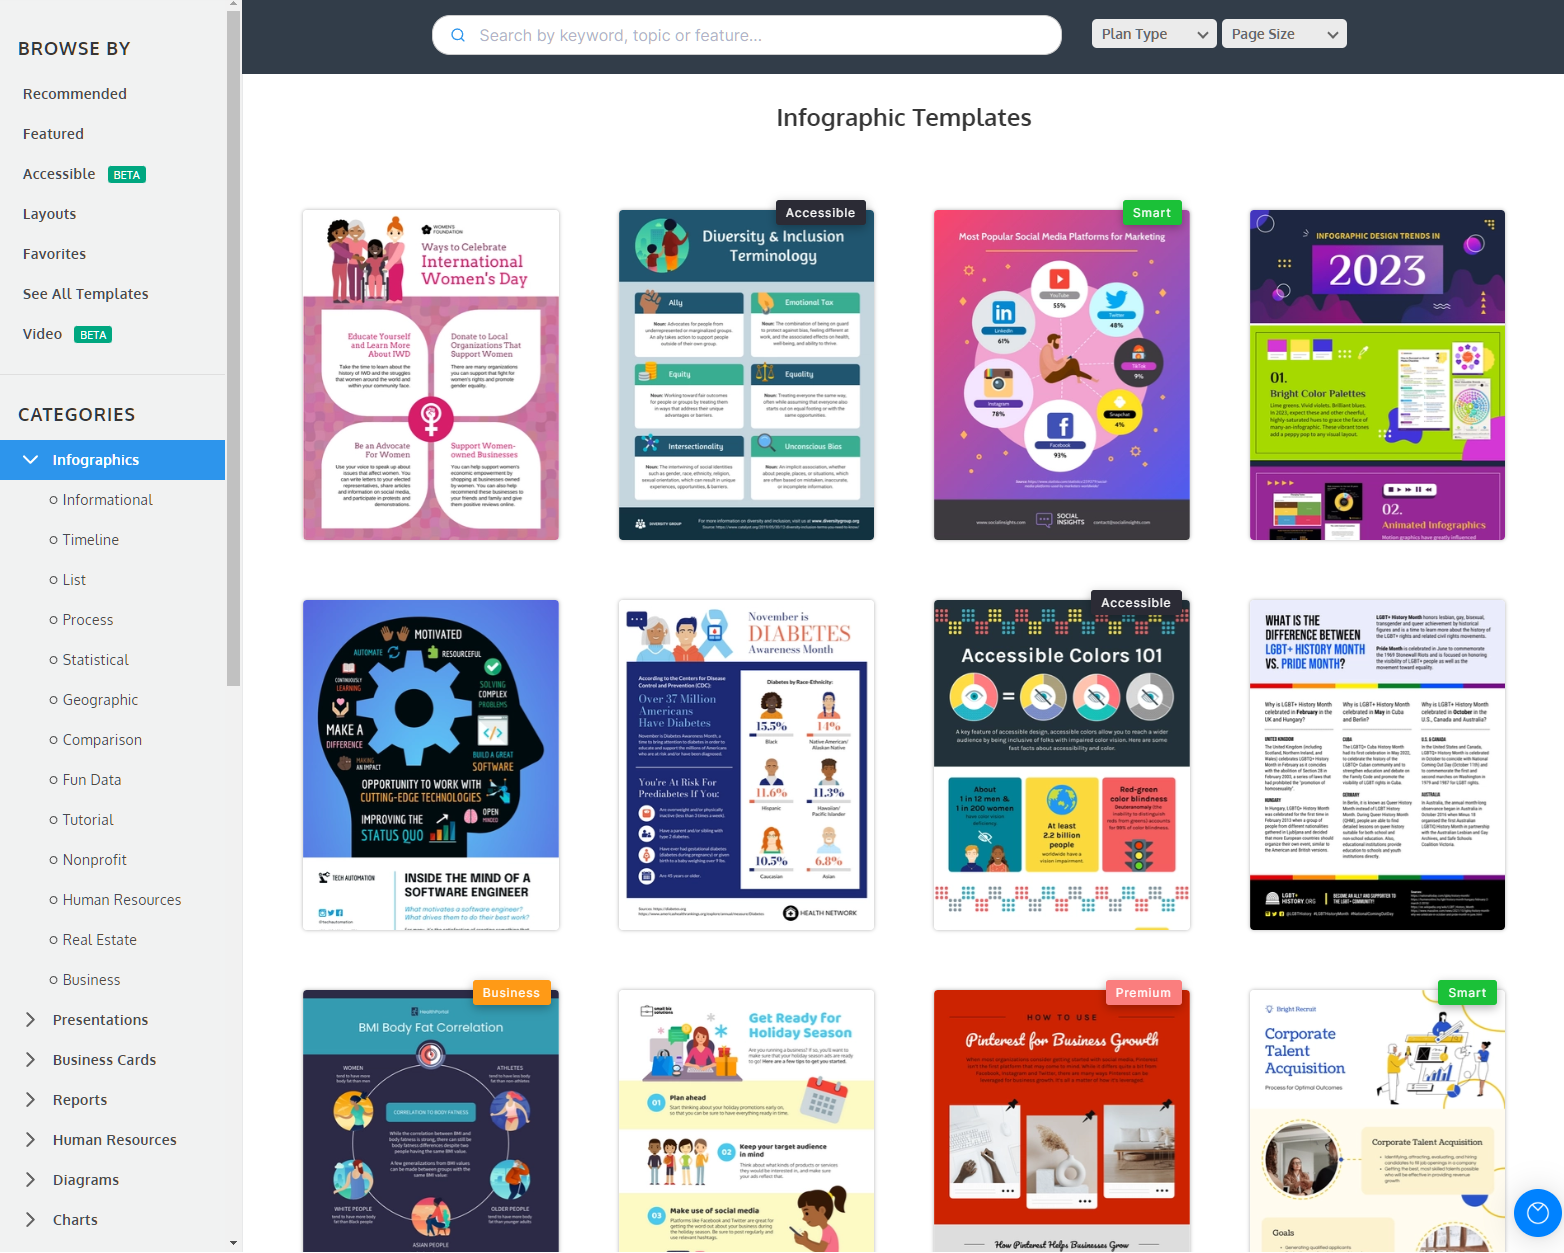
Piktochart
Piktochart is another cloud-based design tool that is perfect for creating infographics, reports, and presentations.
With Piktochart, you can create custom designs using a range of templates, graphics, and charts.
Piktochart and Venngage have very similar interfaces and features, so choosing which one you prefer will come down to preference of options and style.
Here are some examples of Piktochart’s system:
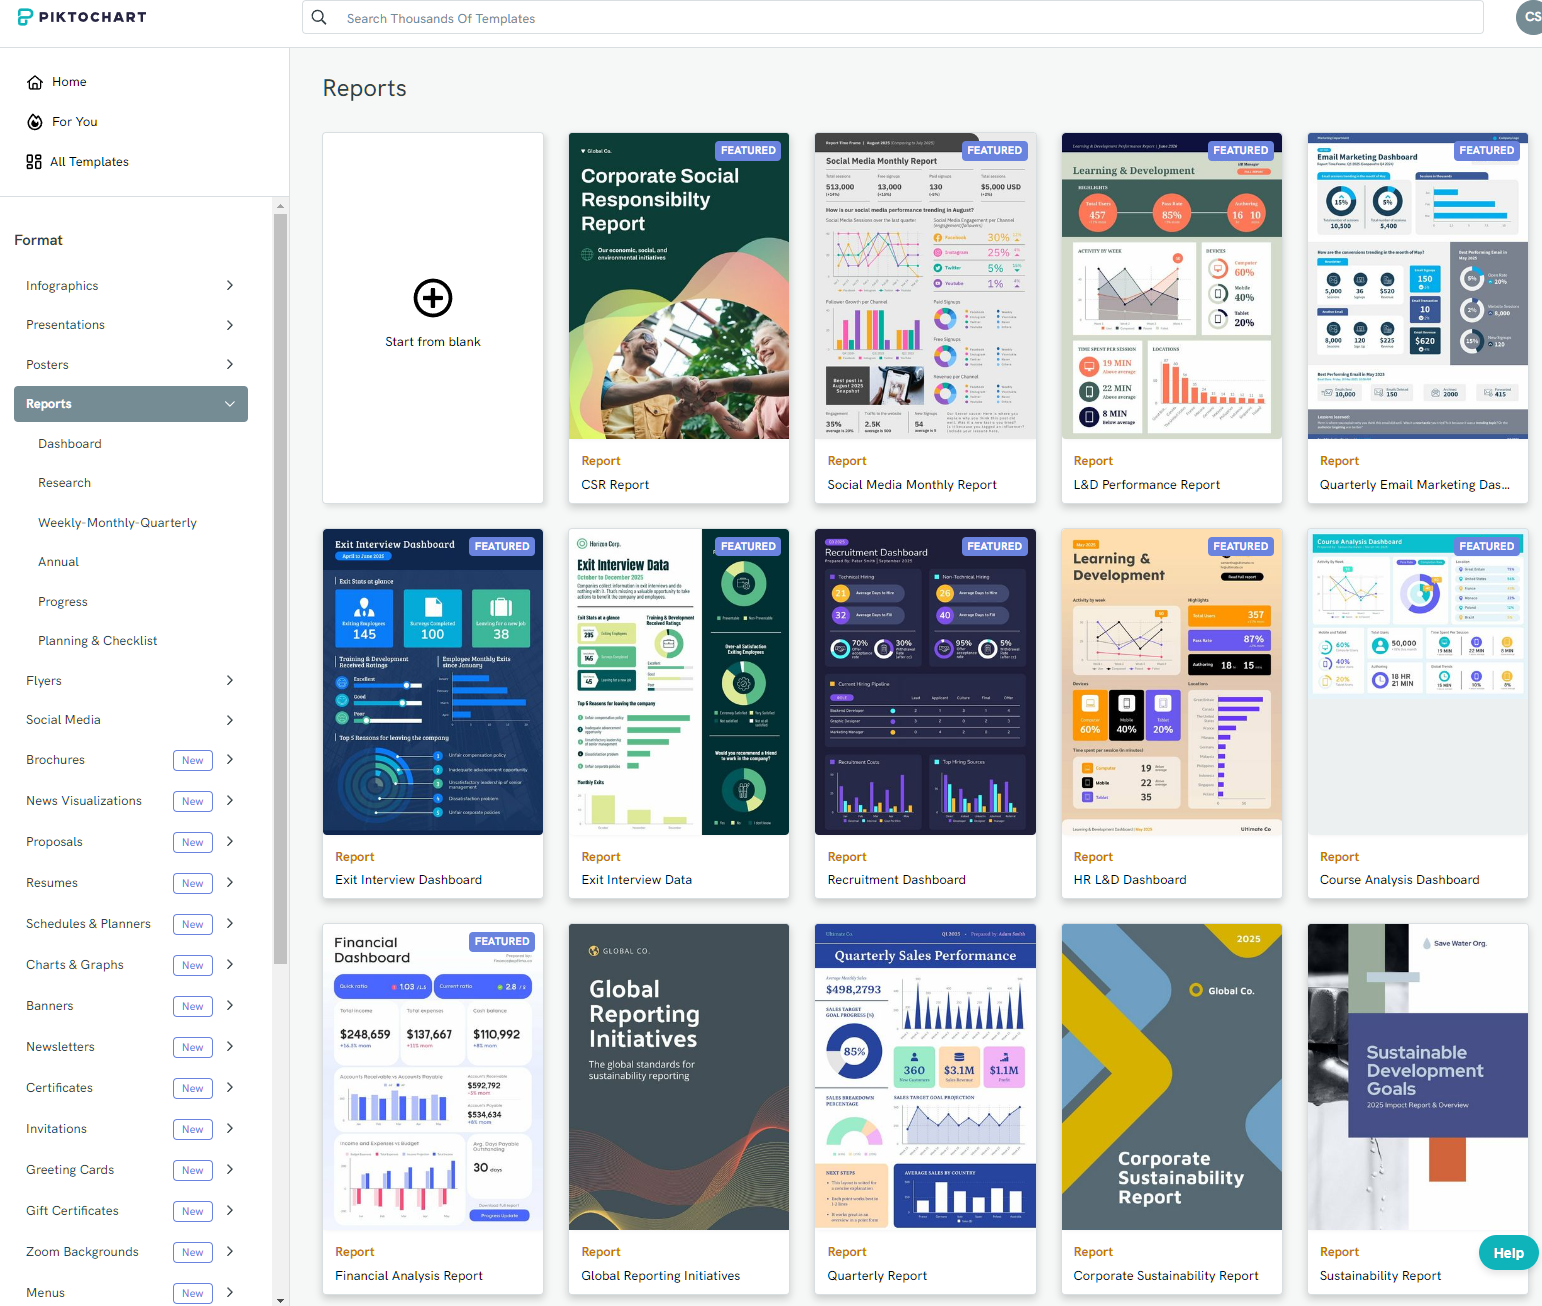
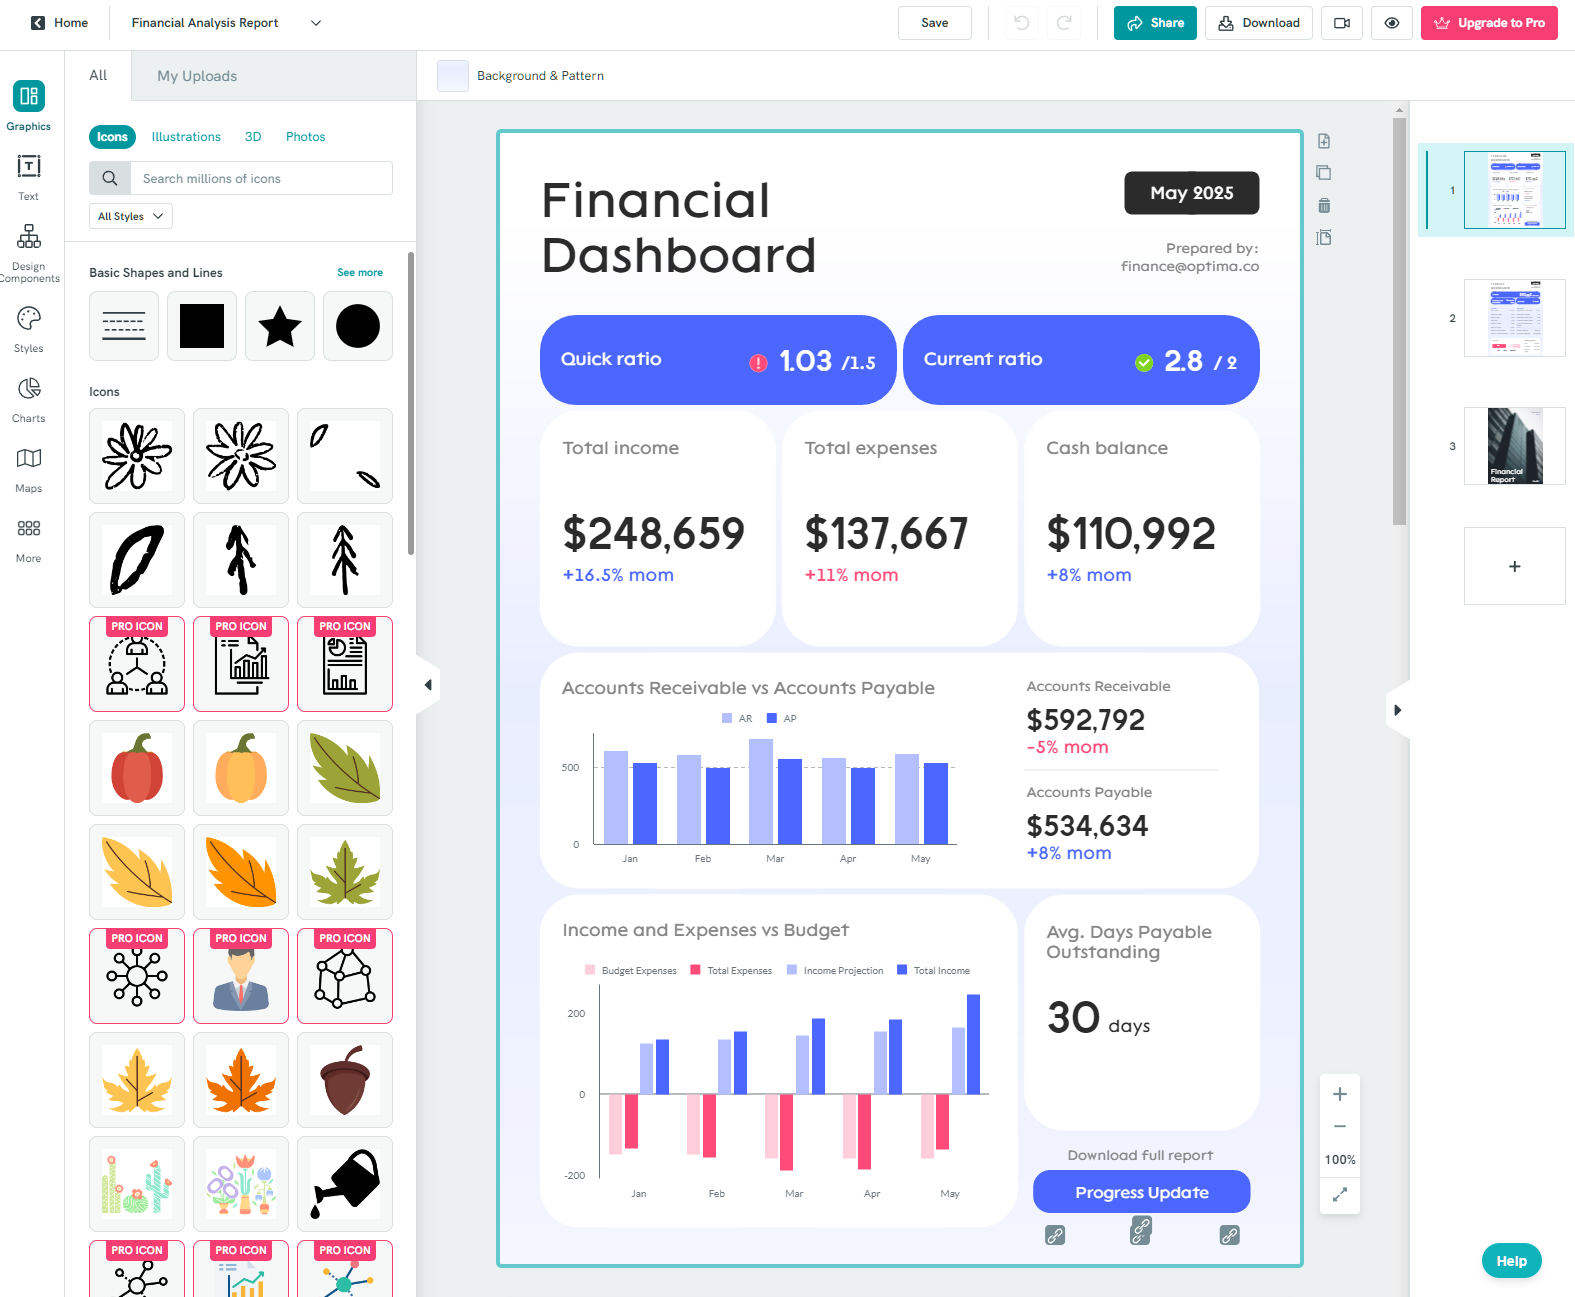
Piktochart is perfect for non-designers who want to create stunning infographics and reports without having to spend hours learning complex design software.
The Importance of Designs and Infographics
Designs and infographics are an essential part of creating engaging content for any blog or website. They play a significant role in conveying information and ideas to readers in a visually appealing and easy-to-understand manner.
Here are some reasons why having designs and infographics is important:
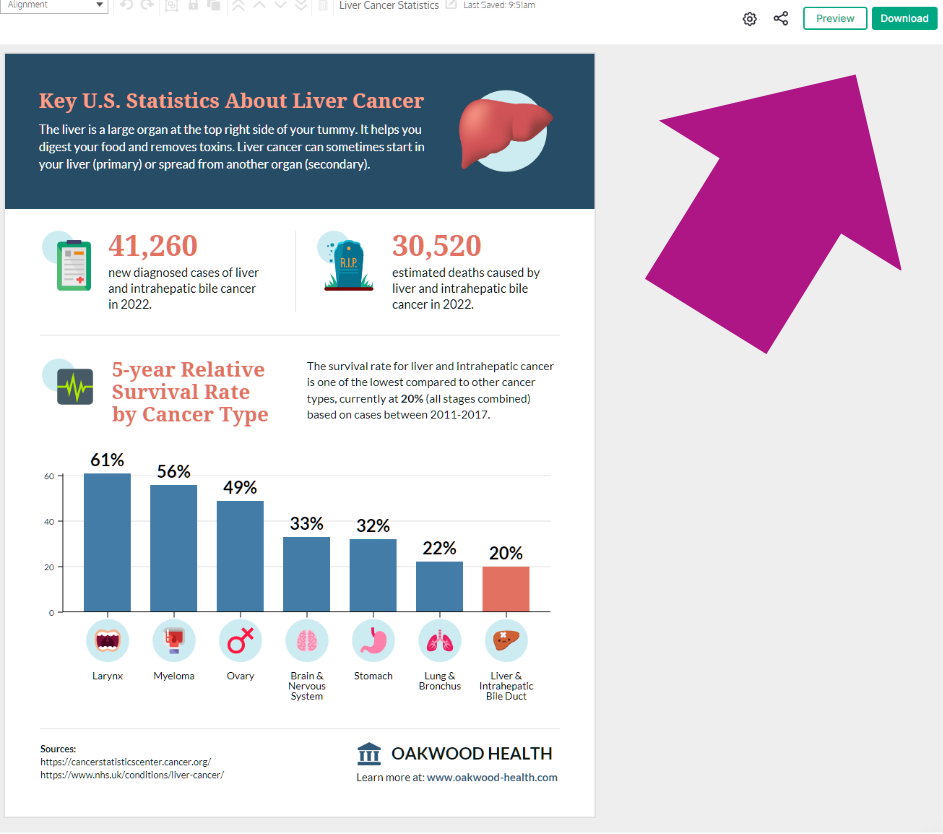
- Infographics and images are highly effective in grabbing the attention of readers. In today’s fast-paced digital world, people are bombarded with information from all directions. A well-designed image or infographic can help your content stand out and catch a reader’s eye. It can also make your content more appealing and keep readers engaged with your article for longer.
- Infographics are an excellent way to communicate complex information quickly and easily. When presented with a large block of text, many readers may become overwhelmed or confused. Infographics can help to break down complex data into easy-to-digest visuals that can be understood at a glance. This can save readers time and effort, making them more likely to engage with your content.
- Designed images and infographics are highly shareable, particularly on social media platforms. People are more likely to share content that looks interesting or visually appealing. By creating eye-catching visuals, you increase the chances of your content being shared, which can boost the reach of your blog or website.
- Using images and infographics can also enhance your branding. Good design can help to establish a consistent look and feel across all of your content, making it easier for readers to identify and remember your blog or website. By incorporating your brand’s colors, fonts, and logos into your infographics and images, you can reinforce your brand identity and improve brand recognition.
- Images and infographics can also boost your website’s search engine optimization. By optimizing your images and using relevant keywords, you can increase the chances of your content appearing in search engine results pages (SERPs) by improving the overall experience and lengthening average time on page. This can drive more traffic to your website and improve your search engine rankings.
Still Not Interested in Design Work?
We get it. It’s tedious and time consuming at its best and mildly to moderately infuriating at its worst. But if you aren’t going to handle it for your practice, someone should. Give us a call at (800) 949-0133 or schedule a one-on-one. Our Incredible Educators are here to help you, anytime, for free.

Christian Shepherd
Content Stategist
Incredible Marketing